Momentum trading is strongly market moving in one direction. The sharp move can be due to news, another type of event or just market volume and volatility.
If you’re smart, you’ll avoid jumping into the market just because it’s moving fast and excitement is on the horizon. Yet, quick moving markets are some of the best opportunities for strong returns in a short period of the time, so we don’t want to stand idle and miss all of the potential.
The majority of traders who jump into momentum moves lose money because they get shook out of the trade. Either they are so late that the market has a complete reversal or they simply jump into the market and can’t manage the trade so they get whipped out even if it does end up going in their direction.
While this acceleration pattern is far from perfect and no strategy can eliminate the market knocking you out of a potentially good trade on occasion, it does give you an opportunity to take advantage of high-profit potential conditions with higher probability.
With this pattern, you can jump into the midst of a strong move and still know it is very likely that the market will continue in your direction without a big retracement which is key for being able to use a tight stop loss and still catch a portion of the move.
In these examples, we use a moving average as a guide, because most trader prefer a visual aid to confirm direction. The pattern itself, however, is based on price action.
The sample chart setup is shown below.
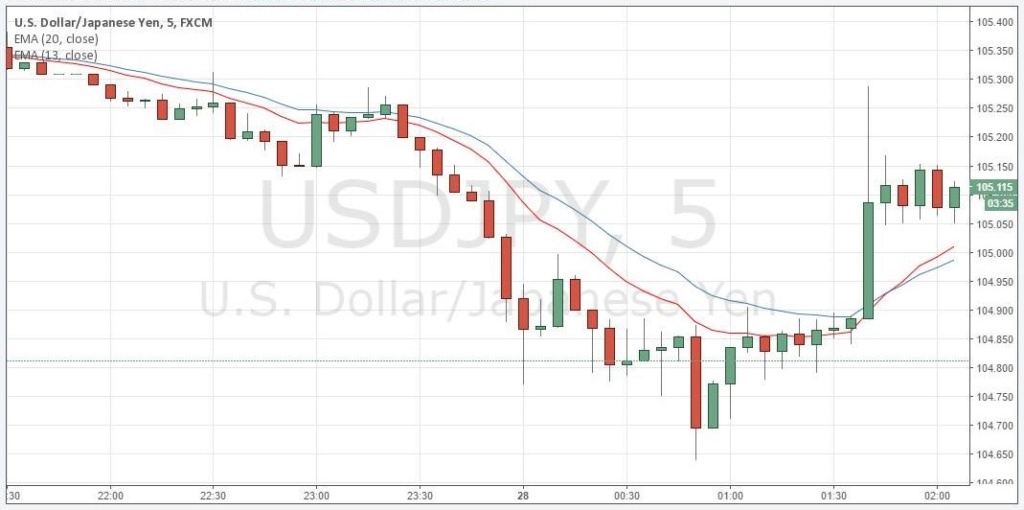
Defining the Pattern:
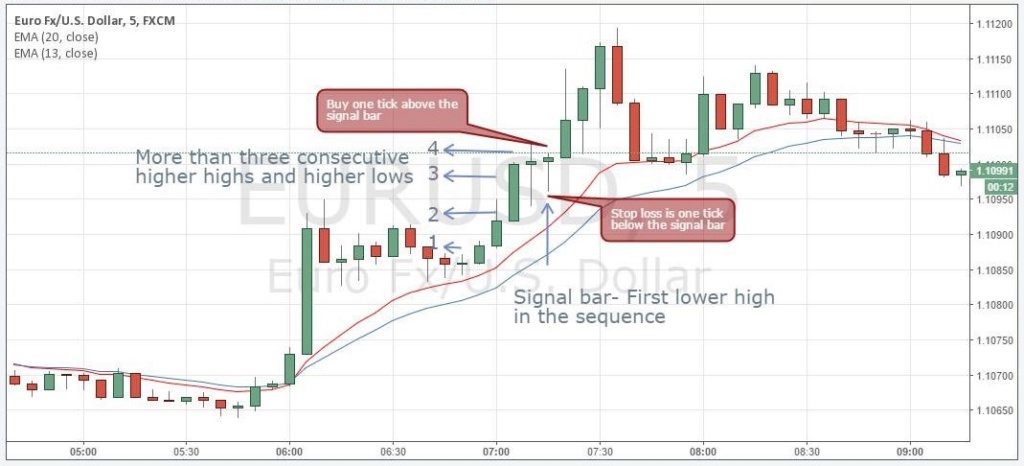
1. Three consecutive bars it should be above/below the 13 and the 20-period exponential moving average.
2. Prior to the signal bar, there should be a minimum of three bars forming consecutive higher highs and higher lows (or lower lows and lower highs in a downtrend)
3. Our acceleration signal is the first bar that makes a lower high in the sequence (in an uptrend)
4. Once we see the “dip” we can potentially place an order to buy one tick above the high of the signal bar. If the next bar breaks out above the signal bar, our order is filled and our trade is live.
5. The low of the signal bar would be the stop loss for the trade.
6. However, if the bar after the signal bar doesn’t move one tick higher than the signal bar, our trade doesn’t get filled and we abandon the setup and start afresh.
Here’s an example:
Entry, stop loss and exit rules!
1. For long positions, we place a buy order one tick above the high of the signal bar.
2. If the next bar to the signal bar doesn’t trigger the trade, we abandon the setup, because, many times, a break in momentum can lead to a consolidation or a reversal. Hence, we want to enter only when the momentum reasserts itself after a pause of one bar.
3. The initial stop loss for the trade is just below the low of the signal bar.
4. As long as momentum continues, you may choose to trail the stop loss 1 bar behind the current live bar or simply keep an eye on the trade and click out when you see momentum fading.
Why does this pattern work?
Once price is above the short-term moving averages, it signals a trend. Three consecutive bars with higher highs and higher lows, signal a momentum build up.
Intraday traders and scalpers tend to take profits when they get a windfall. On the other hand, the short sellers are looking to short, as they believe that the trade is overextended.
The market loves to crush over-aggressive reversal traders which is often why we see a short, small pause before an additional run that kills those positions. Being on the other side gives us a quick momentum-filled trade in our direction.
Example of a short trade
This setup works equally well in a falling market as it does in a rising market, as shown in the chart below:

The EUR/USD starts to drop and we get our signal bar after three consecutive bars, which make lower lows and lower highs. Our signal bar doesn’t make a lower low. We place a sell order one tick below the low of the signal bar, which gets filled and our trade is live. Our initial stop loss is one tick above the signal bar. We trail our stops higher and book profits when our price objective is met.
An example of a trade which did not meet our rules, hence, was filtered out.
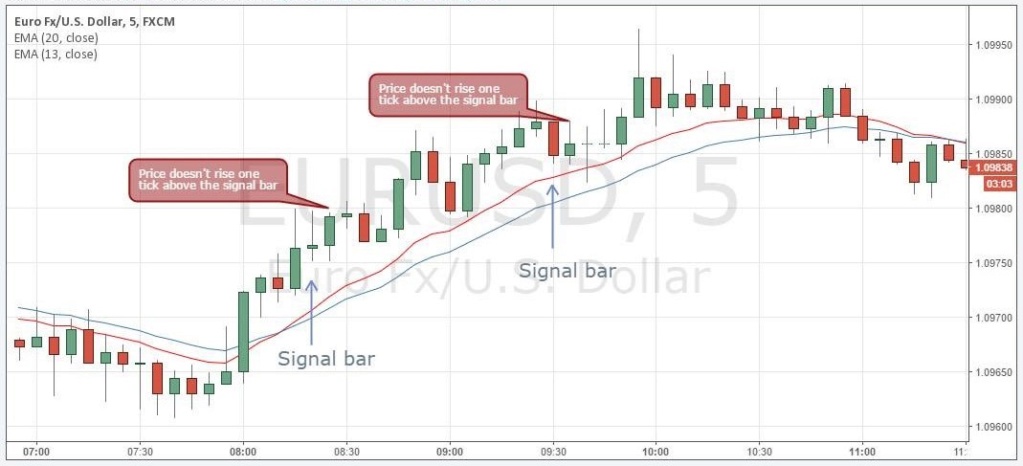
At times, the next bar after the signal bar fails to break above the signal bar, as shown in the chart above. According to our rules, we leave the trades and don’t chase them.
Sure, sometimes they still work out wonderfully like above. But we’re simply playing the *odds with this setup and the percentages say that a break of the high from the next bar increases the odds of a higher run up.
Another example of a long trade:
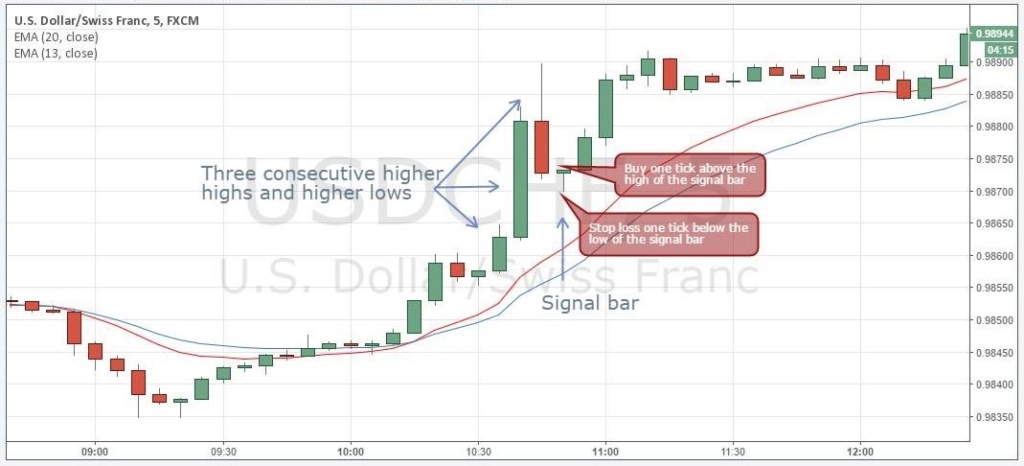
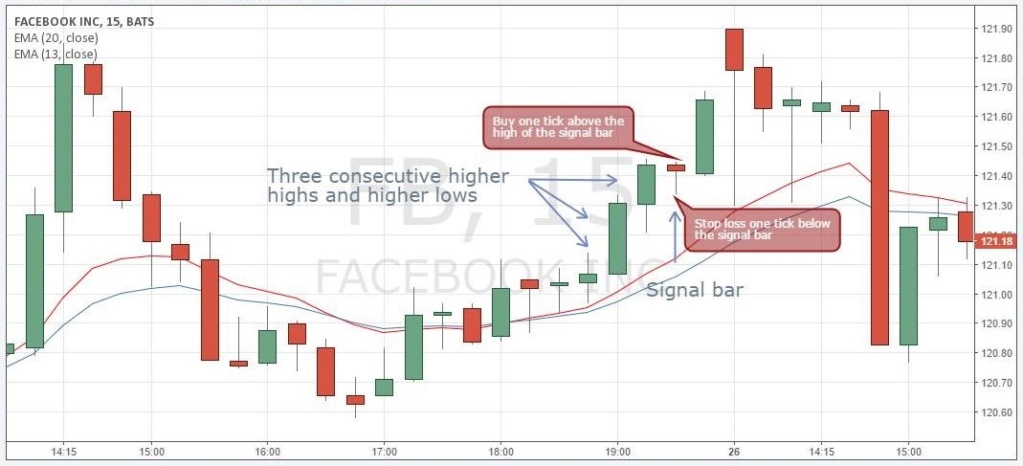
The set up not only works on currency pairs, it works equally well for stocks exhibiting momentum, as shown in the charts below.
Long setup on the 5-minute chart of Apple:
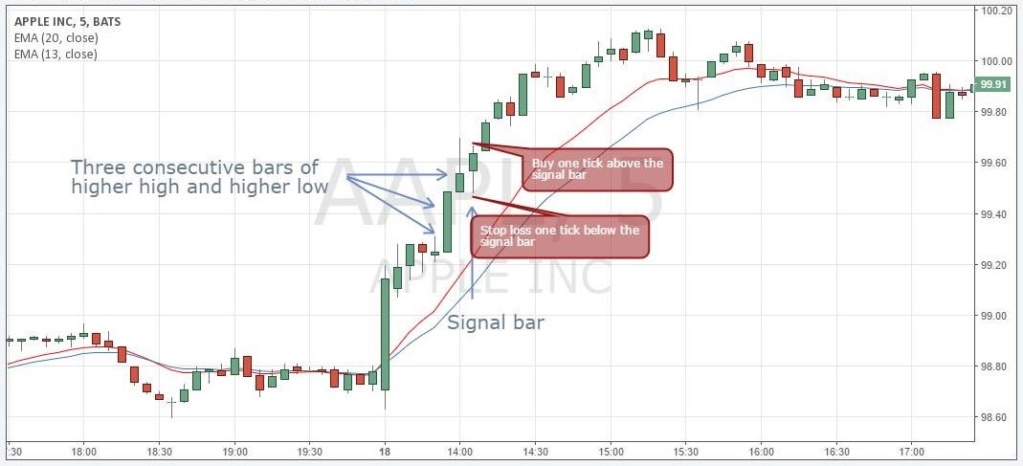
An example of a long setup on the 15-minute chart of Facebook:
This is a pattern best suited for momentum markets. Spotting the pattern is pretty straight-forward with a little practice.
- Set up the chart with 13 and 20-period exponential moving average.
- For long trades, the price should be above both the moving averages.
- Look for three successive bars which form higher highs and higher lows. This confirms momentum and trend.
- Now look for the bar, which fails to make a higher high in the sequence of the trend. This will act as our signal bar.
- As soon as we locate the signal bar, we place a buy order one tick above the high of the signal bar.
- The next bar after the signal bar should move higher and fill our trade. If it does, our trade is live.
- We place the stop loss, one tick below the low of the signal bar.
- Our target is to take profits when price reaches two times the initial risk.
Note that this is a potential opportunity and not a strategy unto itself. That’s because I am giving you a narrow look at a price action signal. I don’t know all the other conditions of a given pair or instrument.
We don’t know the longer term trend, key support and resistance areas, etc. So this is simply a pattern to look out for and not a strategy you should use as stand alone. That said, once you get good at identifying this pattern in momentum markets, I think you’ll be able to utilize it with your strategy very effectively.
*Odds are a numerical expression, usually expressed as a pair of numbers, used in statistics. In statistics, the odds for or odds of some event reflect the likelihood that the event will take place, while odds against reflect the likelihood that it will not.Odds are expressed in several ways , and sometimes the term is used incorrectly to mean simply the probability of an event.In statistics, the odds for an event E are defined as a simple function of the probability of that possible event E. One drawback of expressing the uncertainty of this possible event as odds for is that to regain the probability requires a calculation. The natural way to interpret odds for (without calculating anything) is as the ratio of events to non-events in the long run. A simple example is that the (statistical) odds for rolling a three with a fair die (one of a pair of dice) are 1 to 5. This is because, if one rolls the die many times, and keeps a tally of the results, one expects 1 three event for every 5 times the die does not show three (i.e., a 1, 2, 4, 5 or 6). For example, if we roll the fair die 600 times, we would very much expect something in the neighborhood of 100 threes, and 500 of the other five possible outcomes. That is a ratio of 100 to 500, or simply 1 to 5. To express the (statistical) odds against, the order of the pair is reversed. Hence the odds against rolling a three with a fair die are 5 to 1. The probability of rolling a three with a fair die is the single number 1/6, roughly 0.17.

 Events
 Blog
Blog





No Comment.